- Poster presentation
- Open access
- Published:
Electromechanical analysis of optimal trigger delays for cardiac MRI
Journal of Cardiovascular Magnetic Resonance volume 16, Article number: P73 (2014)
Background
Single-phase cardiac MRI acquires data only during a brief period of the cardiac cycle. To avoid motion artifacts, the operator must select a trigger delay that corresponds to a period of minimal cardiac motion, typically at end-systole or mid-diastole. This can be done by inspecting a prior cine scan for quiescent periods. However, because these cardiac phases can vary in temporal position and duration as a function of heart rate, another option should be available if the heart rate at the time of the single-phase scan differs from that during the cine scan. The goal of this work was to analytically determine the optimal trigger delays for cardiac MRI.
Methods
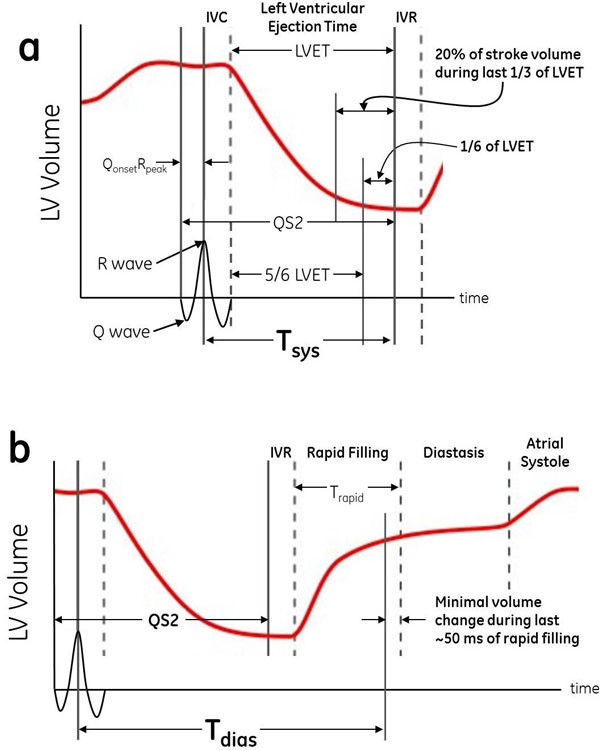
An electromechanical analysis of Wiggers diagram was used to determine the trigger delays (time after R-wave) at which systolic and diastolic quiescence begin (Figure 1).
Left ventricular volume graphs from Wiggers diagram demonstrating optimal trigger delays for single-phase cardiac MRI. (a) Minimal systolic motion begins during the last 1/6 of LVET, when the left ventricular volume change is small. Tsys = IVC + 5/6 LVET, where LVET = QS2 - QonsetRpeak - IVC. (b) Minimal diastolic motion begins slightly before the end of the rapid filling phase. Tdias = QS2 - QonsetRpeak + IVR + Trapid - 50.
Systole
End-systolic quiescence occurs during isovolumic relaxation, but due to the averaging effect of the data acquisition window, reduced heart motion appears slightly earlier. Also, because 20% of the stroke volume is ejected during the last 1/3 of the LV ejection time (LVET) [1], it is assumed here that minimal cardiac motion actually begins during the last 1/6 of LVET. Thus, the optimal systolic trigger delay Tsys should occur at 5/6 (83%) of LVET. From Figure 1a, Tsys = IVC + 0.83*LVET, where LVET = QS2 - QonsetRpeak - IVC. Using the substitutions IVC = 40 ms [2], QS2 = 541 - 2.2*HR [3], and QonsetRpeak = 40 ms [4], this gives Tsys = 423 - 1.826*HR (where HR is heart rate in beats per minute).
Diastole
End-diastolic quiescence occurs during diastasis, but for MRI scans, sufficiently reduced motion can begin 50 ms earlier [5]. Thus, the optimal diastolic trigger delay Tdias begins 50 ms prior to the end of rapid filling (Trapid). From Figure 1b, Tdias = QS2 - QonsetRpeak + IVR + Trapid - 50. Using the above substitutions with IVR = 80 ms [6] and Trapid = 313 - 0.957*HR [7], this gives Tdias= 894 - 3.157*HR. These models were compared with ECG-gated short-axis cine scans from 87 adult patients that were retrospectively studied to identify the systolic and diastolic trigger delays at which minimal heart motion began. To assess the efficacy of the equations in a clinical population, only patients with significant akinesis or dyskinesis were excluded. Tdias was recorded only for patients exhibiting discernible periods of diastasis.
Results
Figure 2 plots measured trigger delay versus heart rate. Excellent agreement is seen between the regression lines for systolic and diastolic data and the values predicted by the equations.
Conclusions
Although previous studies have presented general quantitative relationships between various heart phases and heart rate, this work derives recommended trigger delays specifically for use with single-phase cardiac MRI. The models demonstrate good agreement with clinical results and can be valuable for automatically selecting optimal trigger delays when the heart rate varies during an exam or when no reference images are available.
Funding
N/A
References
Johnson : Circ. 1975, 52: 378-10.1161/01.CIR.52.3.378.
Hirschfield : Circ. 1976, 54: 751-10.1161/01.CIR.54.5.751.
Boudoulas : Chest. 1981, 80: 613-10.1378/chest.80.5.613.
Goldberger : J Appl Physiol. 1983, 54: 1083-
Bowman : Am J Physiol Heart Circ Physiol. 2004, 287: H1650-10.1152/ajpheart.00269.2004.
Lind : Eur J Echocardiography. 2004, 5: 284-10.1016/j.euje.2003.11.007.
Chung : Am J Physiol Heart Circ Physiol. 2004, 287: H2003-10.1152/ajpheart.00404.2004.
Author information
Authors and Affiliations
Rights and permissions
This article is published under license to BioMed Central Ltd. This is an Open Access article distributed under the terms of the Creative Commons Attribution License (http://creativecommons.org/licenses/by/2.0), which permits unrestricted use, distribution, and reproduction in any medium, provided the original work is properly cited. The Creative Commons Public Domain Dedication waiver (http://creativecommons.org/publicdomain/zero/1.0/) applies to the data made available in this article, unless otherwise stated.
About this article
Cite this article
Slavin, G.S., Fung, M. Electromechanical analysis of optimal trigger delays for cardiac MRI. J Cardiovasc Magn Reson 16 (Suppl 1), P73 (2014). https://doi.org/10.1186/1532-429X-16-S1-P73
Published:
DOI: https://doi.org/10.1186/1532-429X-16-S1-P73

